Today Markets SupportToday Markets Support
  • Home
  • About
    • About us
    • Our Mission
  • Knowledge Base
  • Documentation
  • General FAQ’s
  • Learn
  • Coverage
    • United Arab Emirates
    • Today Markets.Com
    • European Union
    • Partner Center
    • Analysis Center
  • Login
  • Home
  • About
    • About us
    • Our Mission
  • Knowledge Base
  • Documentation
  • General FAQ’s
  • Learn
  • Coverage
    • United Arab Emirates
    • Today Markets.Com
    • European Union
    • Partner Center
    • Analysis Center
  • Login
Home/Knowledge Base/Patterns And Candles/Morning Star Pattern

Morning Star Pattern

20 views 0 March 10, 2024 today-markets

What is a Morning Star Pattern?

Morning star pattern is a bullish three period candlestick formation that consists of…

  • a long red candle followed by…
  • a small red or green candle (or doji) that gaps below the close of the previous candle followed by…
  • a long green candle (stronger signal if gaps up)

It is also a leading short-term reversal indicator.

Morning StarMorning Doji Star

Why are Morning Stars important?

  • The red candlestick confirms that the downtrend remains intact and bears dominate.
  • When the second candlestick gaps down, it provides further evidence of selling pressure.
    • The small candlestick indicates indecision and a possible reversal of trend. If the small candlestick is a doji, the chances of a reversal increase (referred to as morning doji star).
  • The third long green candlestick provides bullish confirmation of the reversal.

So how do I use Morning Star candles?

Since morning stars are signals of a potential bullish reversal after a downtrend they are helpful in confirming a significant bottom especially when found near support. They are most useful in stop-loss placement with stops typically placed just below the completed formation.

Example 1: Morning star candlestick formation – EUR/AUD, 2min (1-23-2009)

Morning Star Chart

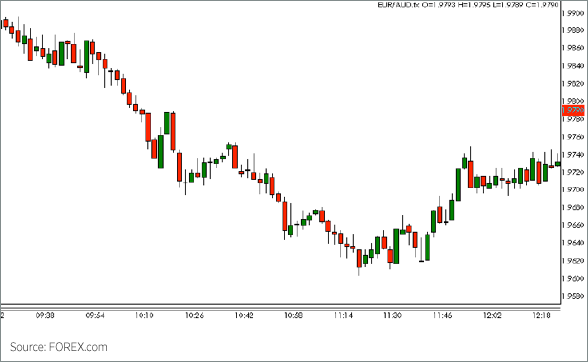
In the above example we have two completed morning star formation which are followed by bullish market reversals.

Was this helpful?

Yes  No
Related Articles
  • Hammer Candlesticks
  • What is a Doji Candle
  • Triangle Chart Patterns
  • Bullish And Bearish Flags
  • Rising or Falling Wedge Pattern
  • Charts And Patterns Intro

Didn't find your answer? Contact Us

Leave A Comment Cancel reply

Popular Articles
  • Managing Risk
  • What Is The Role Of Energy Commodities
  • Electricity Penetration
  • Emerging Market Growth
  • Charts And Patterns Intro
KB Category
  • Energy Commodities
  • MetaTrader 5
  • Cryptocurrencies
  • Patterns And Candles
  • Trading Know How
  • Account And Features
  • Tips For Traders
  • Trading And Conditions

  Hammer Candlesticks

manual
Today Markets enhances our customer support plan with our expanded services. We offer a full range of support options that provide flexibility for customers who need dedicated resources to manage their support requests.
Company
  • Today Markets Partners
  • Today Markets Analysis
  • Today Markets Ireland
  • Today Markets Global
  • Today Markets UAE
SUPPORT
  • Knowledge Base
  • Video Manuals
SOCIAL
  • Facebook
  • Twitter
  • Privacy Policy
  • Terms of Use
  • Mission And Vision
  • © 2025 todaymarkets.com. All Rights Reserved.